| Project information : |
Sales and Customer Insights Analysis for RMS
As a Data Scientist, I conducted an in-depth analysis of sales, customer segments, and shipping data for RMS, a London-based office supplies and furniture retailer. The study leveraged advanced Excel functionalities, including Pivot Tables, INDEX-MATCH lookup functions, and data visualization techniques, to derive actionable business insights.
- The project aimed to analyze order data from 3 years and provide insights to help the Liverpool division of RMS make data-driven decisions. The analysis was structured into three case scenarios addressing various business aspects.
-
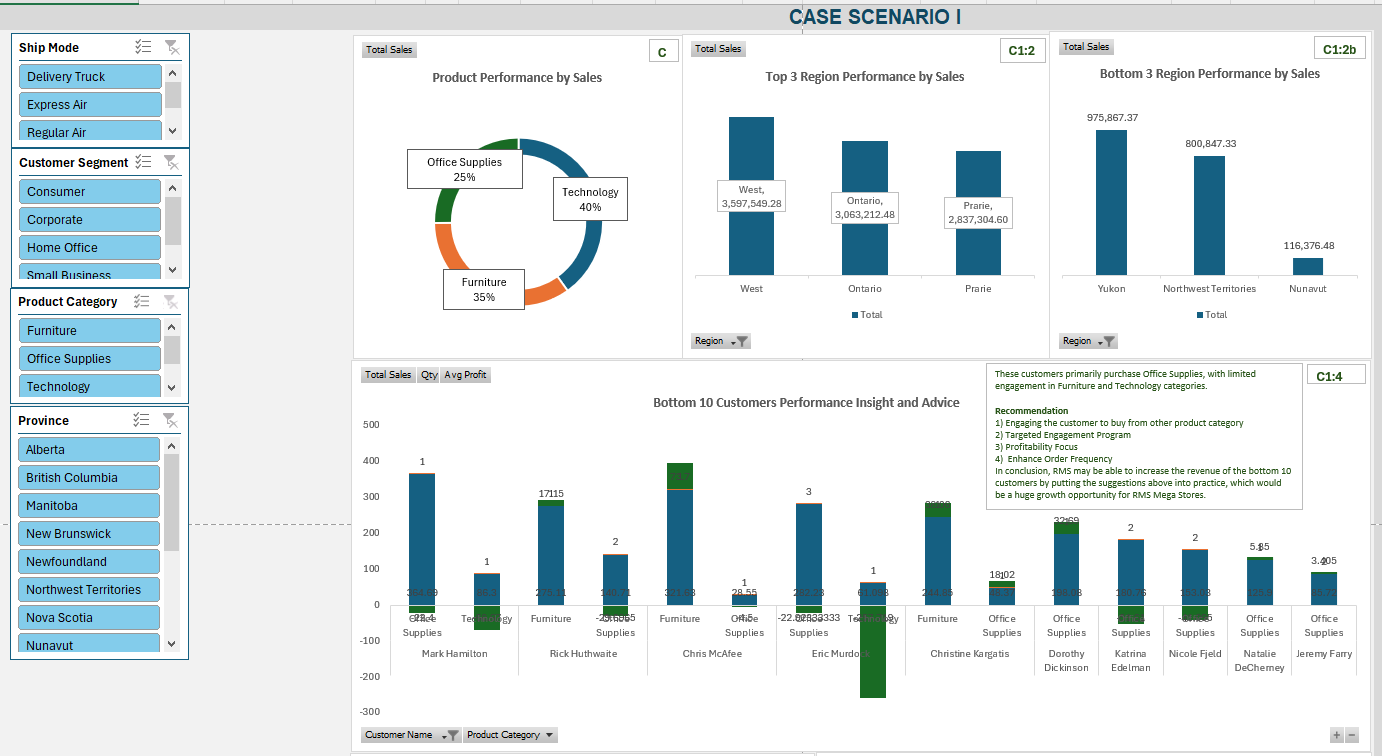
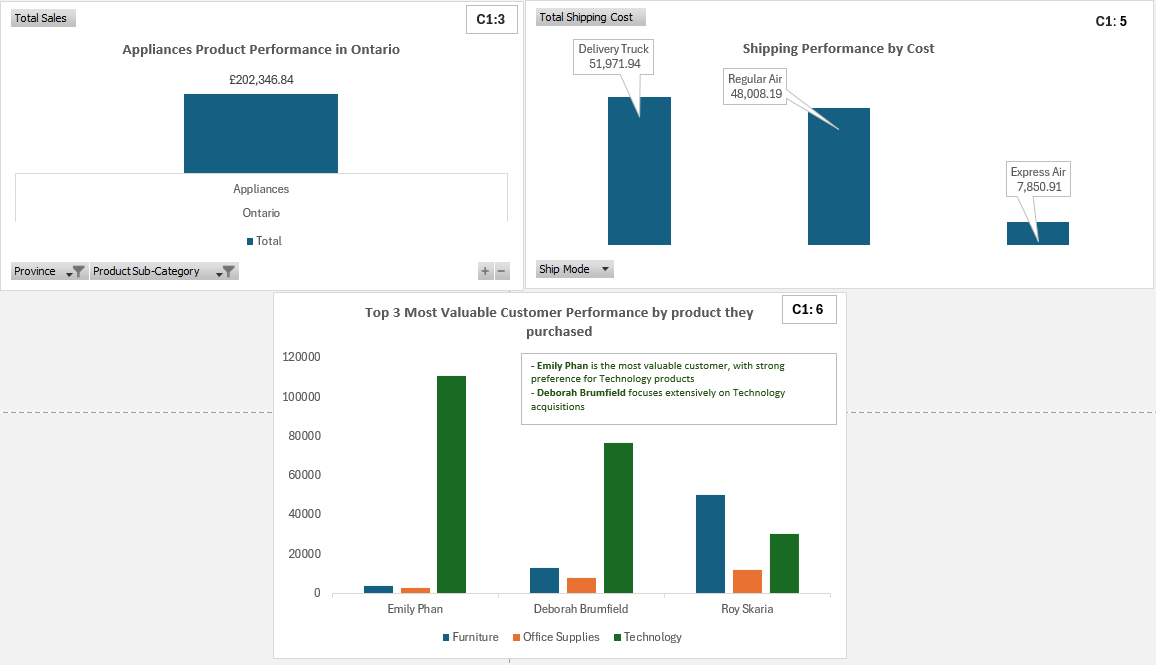
Case Scenario I: Sales Performance Analysis
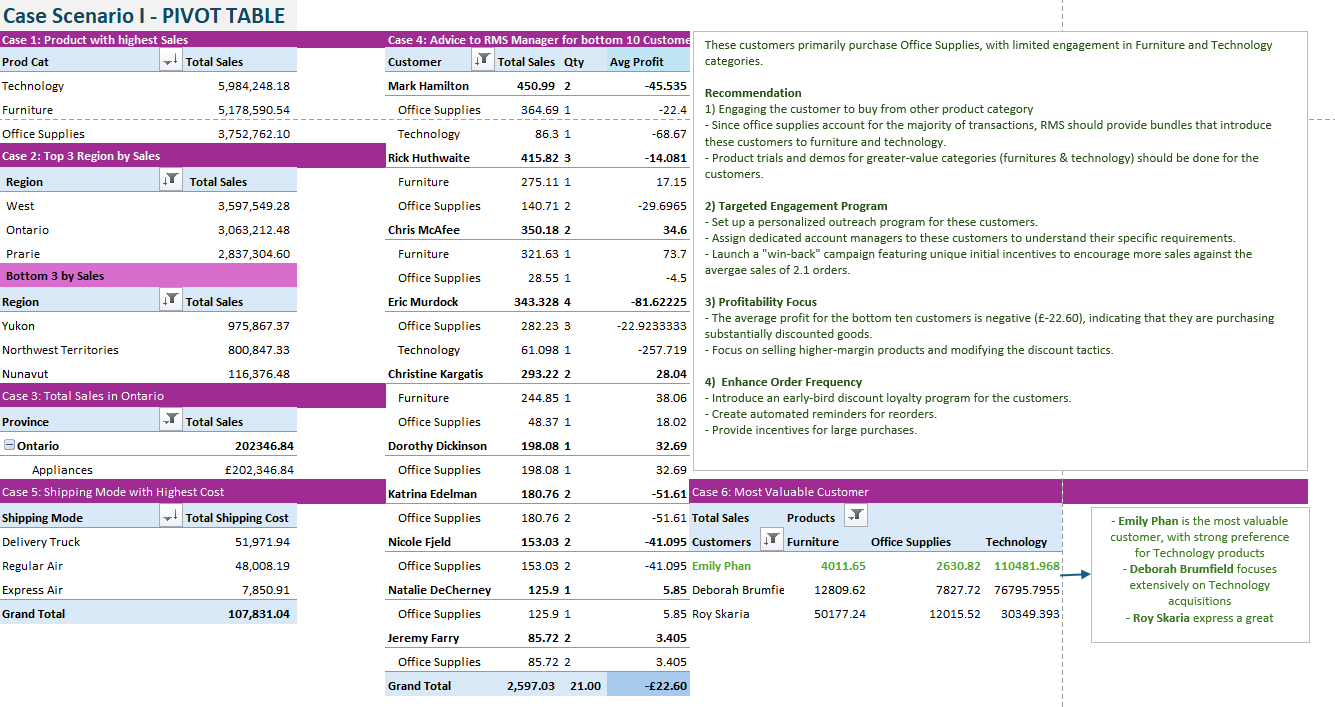
- Top-Selling Product Categories: Identified the category with the highest sales volume?
- Regional Sales Analysis: Ranked the top three and bottom three sales-performing regions?
- Geographic Performance: Evaluated total sales for appliances in Ontario?
- Customer Revenue Optimization: Provided recommendations to increase revenue from the bottom 10 customers?
- Shipping Cost Evaluation: Identified the most costly shipping method?
- Customer Value Assessment: Analyzed the most valuable customers and their purchasing behavior?
-
-
-
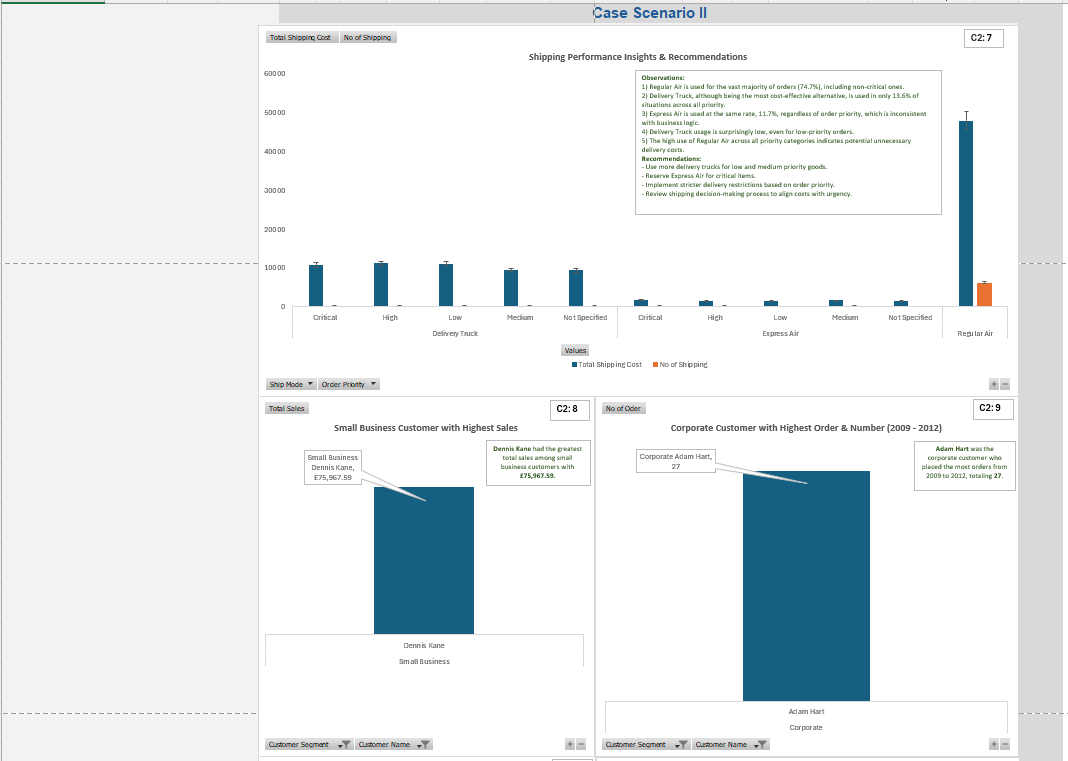
Case Scenario II: Customer & Shipping Efficiency Analysis
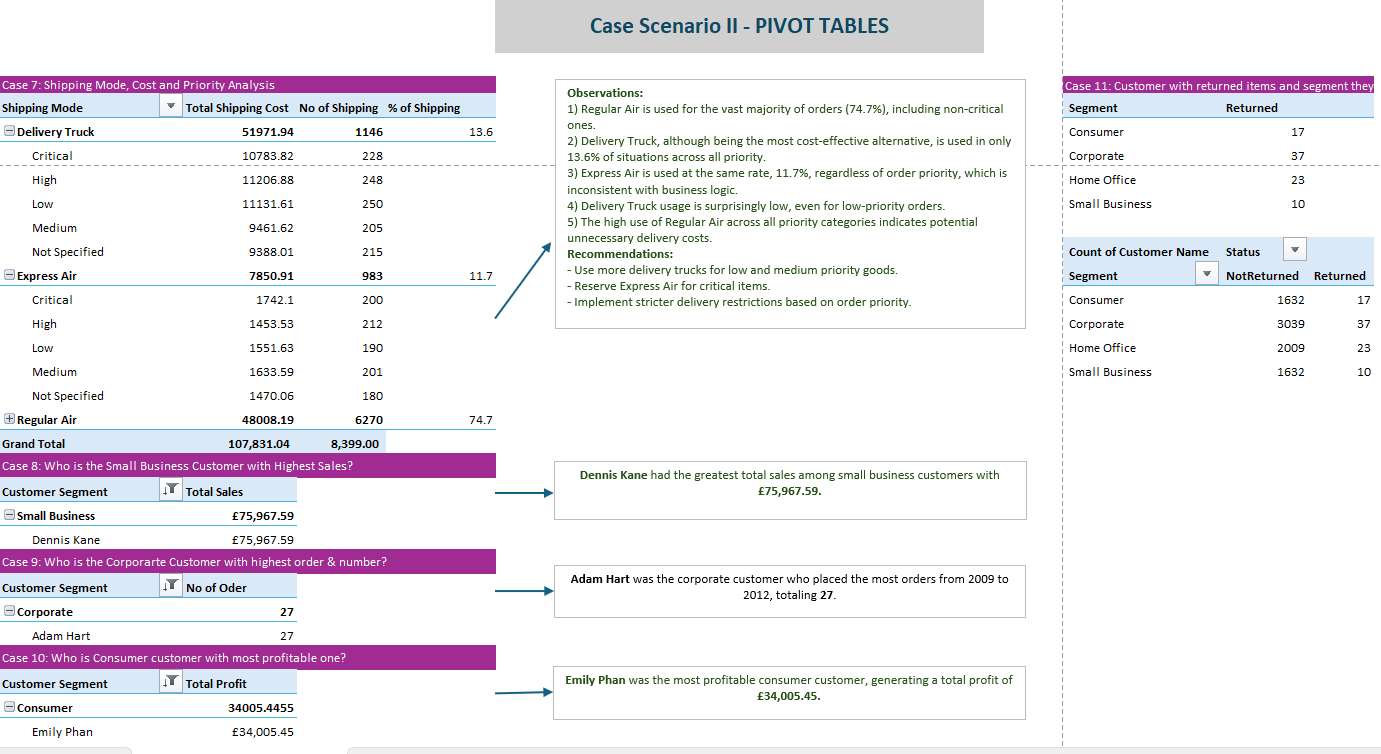
- Shipping Cost Efficiency: Evaluated whether shipping costs were appropriately spent based on order priority?
- Small Business Performance: Determined the small business customer with the highest sales?
- Corporate Order Analysis: Identified the corporate customer with the highest number of orders from 2009-2012?
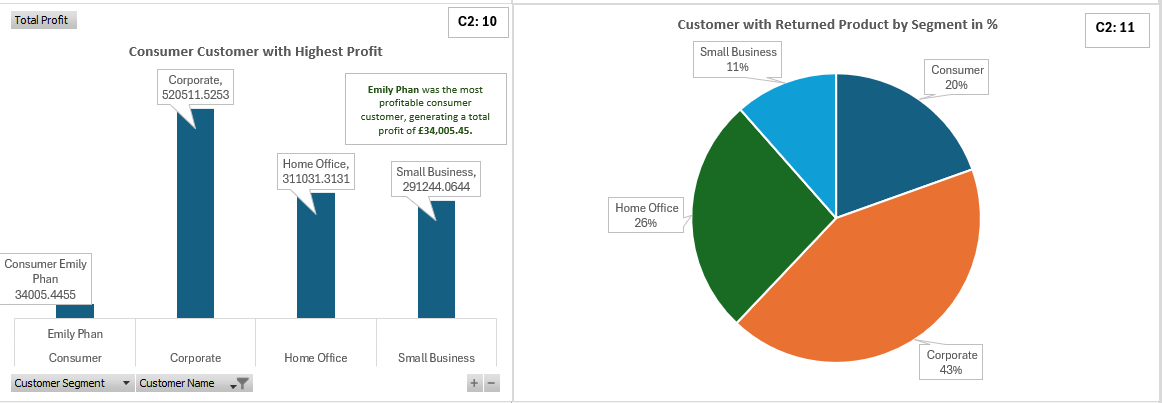
- Profitability Analysis: Determined the most profitable consumer customer?
- Returns Analysis: Examined customer returns and their segment classification?
-
-
-
The Pivot Tables
- Shipping Cost Efficiency: Evaluated whether shipping costs were appropriately spent based on order priority?
- Small Business Performance: Determined the small business customer with the highest sales?
- Corporate Order Analysis: Identified the corporate customer with the highest number of orders from 2009-2012?
- Profitability Analysis: Determined the most profitable consumer customer?
- Returns Analysis: Examined customer returns and their segment classification?
-
-
-
Technical Implementation
- Data Cleaning & Processing: Standardized data formats, handled missing values, and ensured consistency.
- Exploratory Data Analysis (EDA): Used Pivot Tables and statistical analysis to uncover trends.
- Data Visualization: Created dynamic charts and graphs for better insight presentation.
- Business Recommendations: Provided data-driven strategies for revenue growth, cost optimization, and customer retention.
- Returns Analysis: Examined customer returns and their segment classification?
-
Key Outcomes & Business Impact
- Identified the most profitable customer segments, enabling targeted marketing strategies.
- Highlighted inefficiencies in shipping cost allocation, leading to potential cost savings.
- Provided actionable insights to improve sales performance and customer engagement.
|
|
|
|
|
|
|
|
|
|
|
|
|
|